Datadog Boosts Performance Monitoring with Log Management, Deep Search, Anomaly Detection
More than 1,000 customers and partners attended DataDog’s inaugural Dash customer and partner conference, where the company extended its infrastructure and app management portfolio.
July 16, 2018

Datadog is extending the functionality to its infrastructure and application performance monitoring portfolio with the rollout of new machine learning-based anomaly detection capabilities, deep search to detect the specific traces and the ability to support massive log volumes.
The company demonstrated the newly released monitoring and analytics features at its first-ever Dash conference, held in New York City last week. The two-day event, which drew more than 1,000 attendees, consisted of engineering workshops, case-study presentations and exhibits by various alliance and integration partners.
Founded in 2010 as an infrastructure monitoring tool provider, Datadog has extended into tracking application performance in recent years and has experienced significant growth. The company now has 700 employees, a figure that has doubled each year. It claims more than 1,000 enterprise customers that use its tools and has 100 partners that include a mix of major ISVs, MSPs, integrators and major public cloud operators Amazon Web Services, Microsoft and Google.

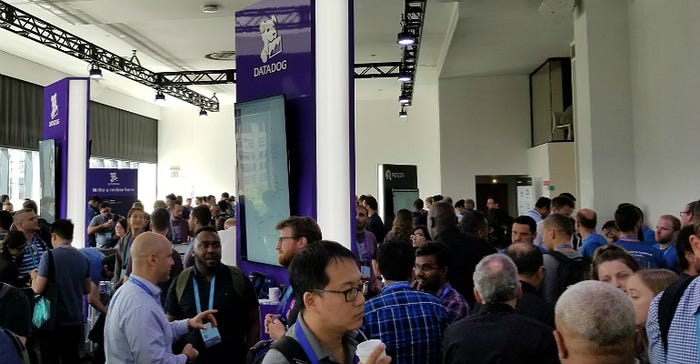
Attendees gather at the DataDog Dash exhibit hall.
Attendees gather at the DataDog Dash exhibit hall.
Datadog competes with a number of large players including New Relic, SolarWinds, Dynatrace and AppDynamics, which Cisco acquired last year for $3.7 billion.
“Datadog is really establishing themselves as a premium, next-generation monitoring tool for cloud,” said Tony Reyes, director of sales at Trek10, a Datadog partner. “We think they’re already there.”
Over the past year, Datadog has expanded into log management with the acquisition of Logmatic, a tool used to gather and analyze operational-event data to troubleshoot debug or audit performance and security metrics. Log management is one of the “three pillars of observability” that many experts describe as necessary in the monitoring of modern infrastructure, application and cloud environments. The other two are metrics and application traces.
“Infrastructure metrics, application traces and logs are really facets of the same story,” said Datadog CEO and co-founder Olivier Pomel, in the keynote address at Dash. “They belong together, and it should be super easy to go from one to the other.”

DataDog's Olivier Pomel on stage at the company's Dash event in New York City, July 11.
DataDog’s Olivier Pomel on stage at the company’s Dash event in New York City, July 11.
Olivier emphasized that the company’s platform is designed to gather at all layers of the infrastructure and application layers and make that data usable for operations teams and developers. Administrators, developers or even business people shouldn’t have to guess whether monitoring data came from a log or a metric in order to find, and then, mitigate a problem, he added.
“The problem rarely stops at the boundary between the infrastructure and the application,” he said.
In a move that aims to remove the cost of log management for cloud-scale applications, the company said it has decoupled ingestion and indexing costs with an offering it calls “logging without limits.” The company now is offering its log-management service at 10 cents per gigabyte, allowing customers to ingest and centralize logs in their own cloud storage at no added cost and the ability to archive all of those logs in services such as AWS S3 storage. The indexing service starts at $1.27 per million events, per month. Customers can turn indexing for subnets of logs on and off as needed.
Datadog also released its new Trace Search and Analytics, which lets administrators pinpoint precise traces to search through massive volumes of application-performance data to pinpoint an exact sequence of events that might be impacting performance.
“This is the Google search bar for your application data and we think it’s going to change the way we all monitor our applications,” said Brad Menezes, Datadog’s director of product management for APM, in a demo at Dash.
The company also launched Watchdog, a new tool that uses machine learning to discover the potential cause of application- and infrastructure-performance degradation, and Service Maps, which shows the dependencies within services.
About the Author
You May Also Like


